
Biorhythms Calculator 2026
Analyze your biorhythms and gain deep insights with this powerful, award-winning app!


Discover your full biorhythm profile!Explore not just Primary, but also I-Ching & Secondary rhythms, Intuitive Patterns & custom cycles
Experience biorhythms like never before!10 customizable & interactive views bring biorhythms to life: Graph, Table, Calendar, Timeline, Report…
Know the best and worst times instantly!Our Unique Activities feature alerts you to prime moments and pitfalls.
Maximize good days, brace for bad ones!Easily track critical days and phase shifts to stay ahead.
Enhance relationships with Compatibility View!Compare multiple people’s rhythms to find harmony.
What biorhythms are and how they can help you.
Have you ever had a really bad day? Maybe you tripped over the cat as you were getting out of bed, ran out of gas on the way to work because you forgot that you needed fill up, botched up a major project that the boss was counting on to get right, and burned dinner. When it was all said and done, you probably wished that you had just stayed in bed that morning.
We all have days like that to some extent. But we also have good days. They might not stand out in our minds like the bad ones do, but everyone has them.
So why are some days horrible and others stellar? Many of us blame it on fate. But what if I told you that you could avoid having bad days?
What if you could prevent even the most devastating of mistakes, improving both your physical and mental health in the process?
You are probably thinking, "Yeah, that would be nice, but I do not have a crystal ball". But you do not need one! All you need to turn those bad days into good days is a basic understanding of biorhythms and how to use them to your advantage. There is no rocket science involved, just a few calculations that you do not necessarily even have to do yourself.
Want to learn more? In the e-book, provided with the product when you buy it, we will go over the concept of biorhythms and explain how you can use them to change your life for the better.
You can learn more about biorhythms on these websites:
Your life is affected by rhythmic biological cycles (biorhythms) that move in sinus curves starting at your birth and continuing throughout your whole life, influencing you in many ways. The three rhythms of particular importance are: Physical that affects your overall fitness and well-being; Emotional that affects you mood and awareness; and Intellectual that affects your logical analysis, memory, and communication.
There are three key components you need to understand about biorhythms:
- The Positive Phase (aka Active Phase) is a phase of a particular rhythm when the abilities associated with it are high. It is located above the X-Axis.
- The Negative Phase (aka Passive Phase) is a phase of a particular rhythm when the abilities associated with it are low and diminished. It is located below the X-Axis.
- Critical Day is a phase (a day) of a particular rhythm when it transitions from Positive to Negative phase, that is: when it crosses the X-Axis from the top down. Since your body is busy adjusting to the swing in the phases, the critical phase is the most vulnerable time for an individual, and the abilities associated with a particular rhythm can be very low.
Here are just a few examples of how biorhythms were used in practice:
- For a long time Air France was using biorhythms to ensure their pilots are less likely to have accidents.
- Biorhythms were also used to select athletes for competition in many different countries (those athletes with high Physical cycle values on competition day would be more likely to be selected).
What is Biorhythms Calculator 2026?

Biorhythms Calculator 2026 is revolutionary new biorhythms software with many unique features you will not find in any other product – all beautifully packaged in a modern and stylish User Interface with Ribbon and Tabs.
Whether you are looking for software to occasionally view, share, or print personalized biorhythm charts, or a tool designed for true biorhythm professionals with large database of profiles and multiple ways to visualize biorhythms, Biorhythms Calculator has everything you need! But don't just take our word for it – read numerous Biorhythms Calculator reviews below!
- 10 different views
- 15 built-in rhythms
- User-defined cycles
- Report generator
- Compatibility views
- Side-by-Side comparisons
- Timeline & Calendar views
- Printing support
- Export to jpg, pdf, csv, and other formats
- Optional Astrology & Numerology
- Calendaring support - MS Outlook, iCalendar
- Built-in Journal
- Threats & Opportunities View
- Overview and Summary views
- Biorhythms Encyclopedia
- Biorhythm Awareness E-Book
- Celebrities Database
- Much more…
Top Features
Learn about some of Biorhythms Calculator's features by viewing screenshots below and reading annotations next to them.

Biorhythms Calculator at a Glance
- Ribbon UI gives instant access to every feature - think Microsoft Office, but for biorhythms
- 11 Views - Graph, Chart, Table, Overview, Timeline, Calendar, Compatibility, Report, Text, Threats & Opportunities, and Journal - can be selected on the left side and let you analyze your cycles in the style that suits you
- You can easily select, edit, and manage profiles, cycles, and activities you want to view on the right side
- Bottom Information pane shows key biorhythm metrics, moon phase, date information, and other useful details about active item in the current view at a glance, keeping all context at hand
- Ribbon controls let you change start date, duration, and icon visualization instantly - you're always working with the time period that matters
- The central area displays the biorhythm chart or another view - it is the heart of the app
- Toolbar above the main viewing area offers quick printing or saving in image or text formats
15 Built-in Biorhythm Cycles
- There are 15 built-in rhythms: 4 Primary rhythms (physical, intellectual, emotional, and intuitive), 3 Secondary rhythms (mastery, passion, wisdom), 3 I-Ching rhythms (aesthetic, awareness, spiritual), 3 Intuitive Patterns rhythms (perception, psychic, success), and 2 rhythm averages (primary and i-ching).
- You can easily toggle various rhythms on and off so you see only the ones you are interested in using the Cycles selector on the right side of the window.
- You can easily change the color of a biorhythm cycle using the drop-down color picker on the toolbar.
- As you hover over various biorhythms in the Cycles Selector, you will see a detailed tooltip with cycle's description and other details.


Custom Biorhythm Cycles
Tailor biorhythm analysis to your life by creating any cycle you need - from hours to decades, and even blend multiple rhythms for deeper insights.
- In addition to the 15 built-in cycles, you can define your own custom rhythms that are based on either a specified fixed period or a combination of other rhythms (combination cycles).
- You can create custom (user-defined) rhythms that are based on a fixed period ranging from sub-day periods measured in hours, to mid-length periods measured in days (like primary rhythms), to really long periods measured in years ( NEW up to 9,999 days ~27+ years in duration) - and all with minute-level accuracy. For example you can create a new rhythm with period equal to exactly 15 days, 10 hours, and 12 minutes
- NEWCreate custom composite rhythms (combination cycles) by combining up to 8 cycles in 4 distinct ways - average, minimum, maximum, or median - and uncover hidden patterns.
Individual Profiles
- Profiles represent individual people whose biorhythms you can analyze. You don't need to re-enter someone's birth date every time you want to view their biorhythms. Simply enter it once and save.
- The profiles can be selected, managed, and edited inside a profile selector pane that appears on the right side of the main window. You can easily organize profiles into convenient groups (folders) such as Family, Friends, etc.
- NEWTo ensure precise biorhythm calculations, you can specify not just birth date, but also birth time and birth time zone when creating or editing a profile.
- You can group profiles not only by folder, but also by their gender or zodiac sign. In addition, you can sort profiles by either their name or age. Should the list of profiles become large, you can always easily locate the needed profile by typing in the first letters of the person's name.
- NEWYou can batch import multiple people to add many profiles at once from various sources like Excel or CSV files, or from VCF vCards. A user-friendly grid interface allows you to preview and edit data before saving it in the program.
- You can even assign a picture or a photo to a profile, so you can more easily locate it.


Multiple Side-by-Side Views with Tabs
Design a workspace that works for you: open any number of views, arrange them freely, and compare data side‑by‑side with the tabbed interface.
- You can open multiple biorhythm view tabs and arrange them freely using the Tabbed Multiple Document Interface (MDI) - side‑by‑side, stacked, or custom splits.
- For example, you can have the Graph View on the left side, and the Table View on the right side; or one above the other; or have a triple split - the possibilities are only limited by the free space on your screen.
- Moreover, views don't need to display the same information. You can easily arrange it so that one view shows one person's biorhythms, while another view shows another person's biorhythms right next to it.
- Just as well, it's possible to show biorhythms of the same person or people in both views but for different time periods, allowing for easy comparison.
See Multiple Profiles in One View
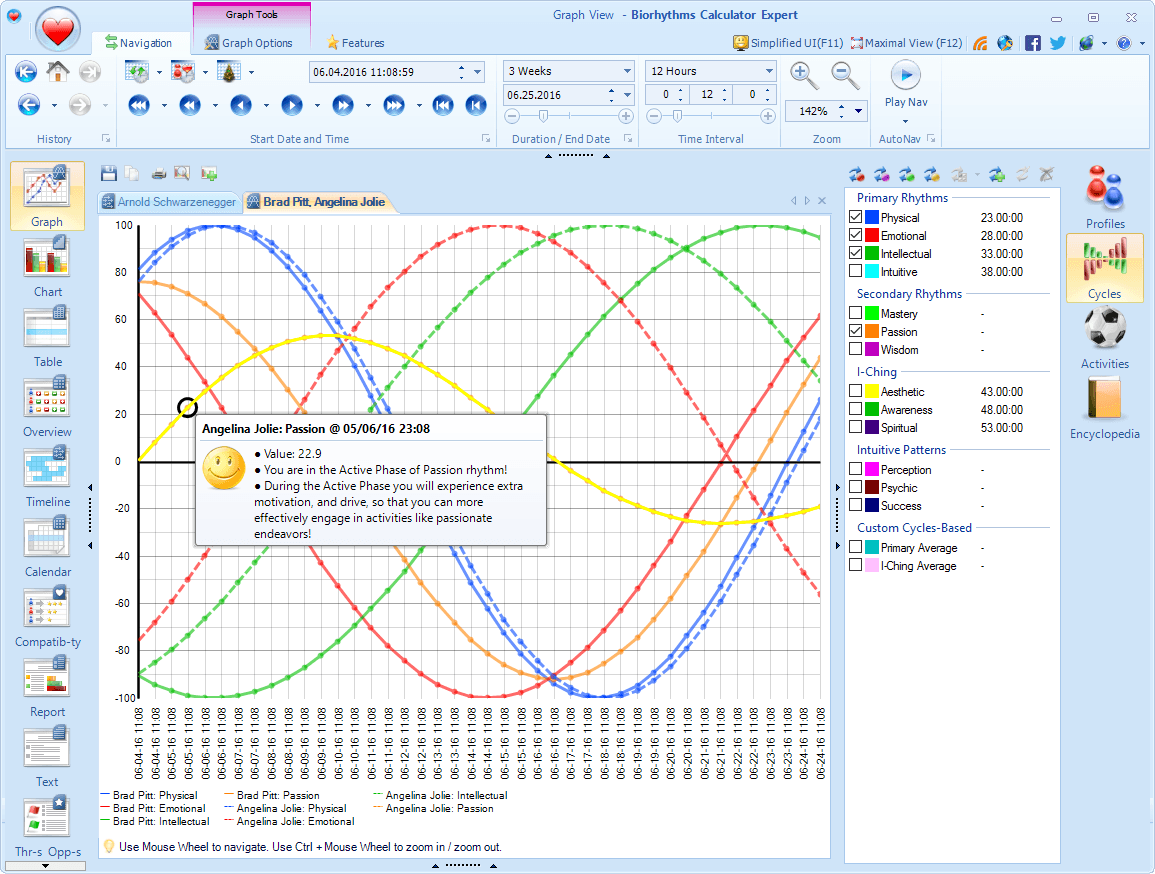
Compare up to five people at once: add or remove profiles with a simple Ctrl+Click and view all rhythms side by side.
- In addition to dedicated Compatibility View, you can easily compare biorhythms of several people in various views by selecting several profiles in the Profile Selector.
- Normally, when you simply click on a profile in a profile selector, this will change the profile displayed in the active view. However, if you Ctrl+Click on a profile, it will add that profile to the active view (or if you Ctrl+Clicked on an already selected profile, it will be removed from the active view).
- On the screenshot you can see an example where the Graph View shows biorhythms for two people and then for 4 people. However you can see biorhythms of up to 5 people in this fashion, and not just in the Graph View, but also in most of the other views like Table, Calendar, and Timeline.


Plan your Day with Biorhythm Activities
Take time planning to the next level and let biorhythms inform your decisions! With the Activities feature, you can plan your day with biorhythms: define activities that trigger when your biorhythms hit the right thresholds and let the app show you the best times for them.
- Activities make it very easy for you to learn the best time to perform certain actions (or the time during which you should avoid doing certain actions). For example, you can define a certain activity in the program that should only be triggered when Physical and Emotional rhythms are above 5%.
- You can then see when you should engage in activities in various views: like Graph NEW, Timeline, Calendar, Report, Threats and Opportunities, and others.
- Compare that to what you'd have needed to do without such a feature. You'd have to manually scroll through long biorhythm charts, looking for days when the rhythms are above or below certain thresholds. That would take hours! With the activities feature, it takes you mere seconds!
- This unique feature is available only in Biorhythms Calculator, and you won't find it in any other biorhythms app!
- You can even export activities to iCalendar format or Microsoft Outlook, so you are automatically reminded about them ahead of time!
- You can use up to 6 different rhythms in activity definition, specifying the range of desired values for each e.g. 25% to 100% with ability to invert it NEW, i.e. -100% to 25%.
- There is no limit to how many activities you can define, and activities can be grouped into folders for easier management.
- NEWYou can even designate some activities as "threats" so they will be presented with a different style throughout the app, alerting you to the fact that these represent time periods you need to be careful of.
Save Information & Export Data from Views
- You can easily save most views or information from them in common file formats for easy sharing and interoperability with other applications.
- For example, biorhythm charts from Graph and Chart views can be copied to clipboard, or saved as
*.pdf-s NEW or images like*.webpNEW,*.jpeg,*.png,*.gifand others. This way you can easily share or e-mail biorhythm charts to your friends, or insert them into documents. - NEWKey biorhythm data like critical days, max/min days, phases, and activities can be exported to iCalendar Format from Timeline, Calendar, Threats and Opportunities, and other views. You can then import these
*.icsiCalendar files into most calendar applications like Microsoft Outlook, Google Calendar, Apple Calendar, and others. This way you can easily keep track of your biorhythms and automatically receive reminders about events ahead of time! - NEWTable-based views - Compatibility, Overview, Table, Threats and Opportunities, and Journal - let you copy to clipboard or Microsoft Excel as well as export displayed data in tabular formats like
*.csvfiles. - NEWDetailed biorhythm reports generated by Report and Text views can be saved as html web pages or text files (
*.html,*.txt) to be easily viewed in any browser, published online, or otherwise preserved or shared.


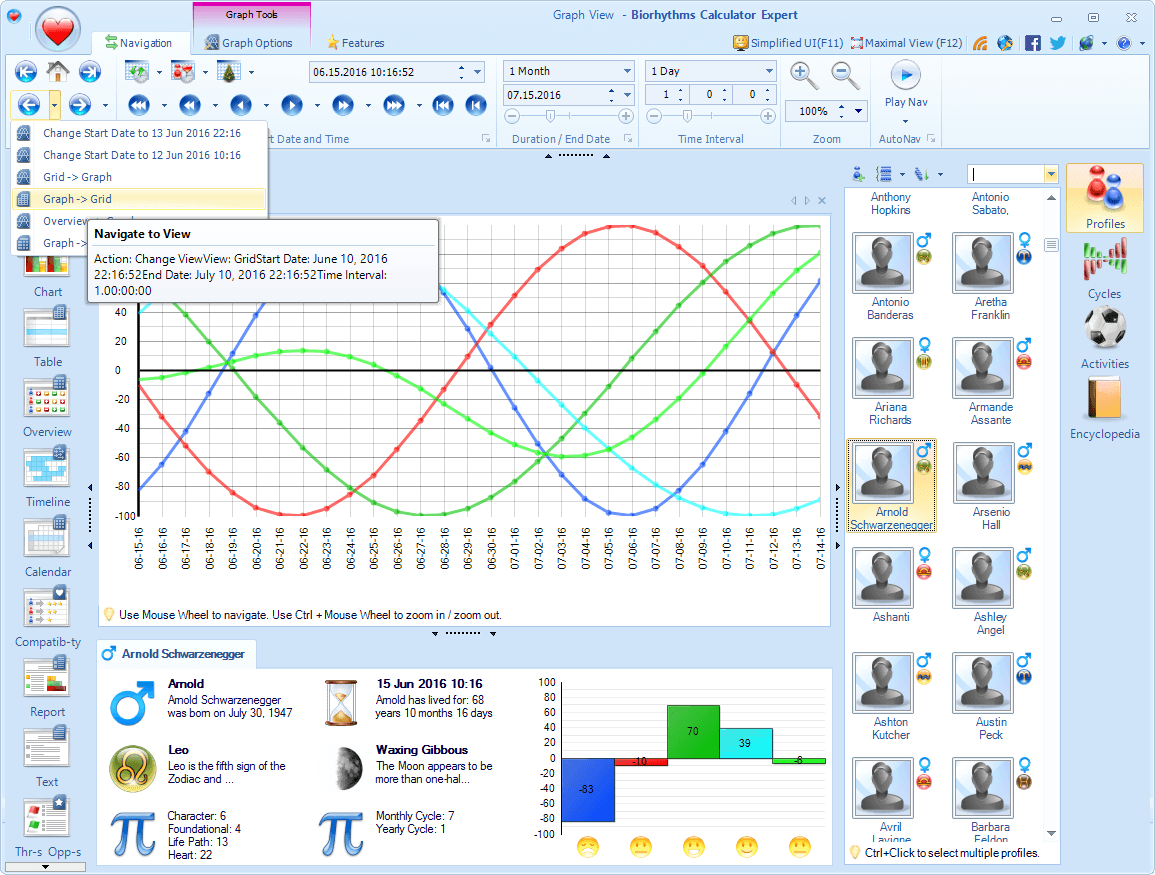
Navigate Your Biorhythms with Ease!
Navigate your biorhythms like a browser: jump forwards or backwards, zoom, and even play your chart in real time!
- Use Ribbon Navigation Tab to change dates, durations, and other settings. As you move your mouse over them, small tool tips will appear with explanations, thus making it very easy to learn all the functionality.
- You can easily navigate forwards and backwards in time as well as zoom in/out using mouse scroll wheel in Graph, Chart, and other views!
- You can precisely change the calculation date for which you want to see your biorhythms; duration for which biorhythms should be calculated; the time interval at which biorhythm values are sampled - all in just a few clicks.
- The program remembers your actions, like changing the view, changing the start date or duration, etc., and saves them automatically into navigation history, so you can easily go backwards and forwards – much like you do in a web browser.
- AutoNav feature lets you "play" your biorhythms live by automatically shifting calculation date either forward or backwards at a set speed, allowing you to see your biorhythm chart come to life with real-time animation!
- What’s more is that the program is very precise: you can specify dates and time intervals to the last second (while in other apps the smallest time unit is equal to one day).
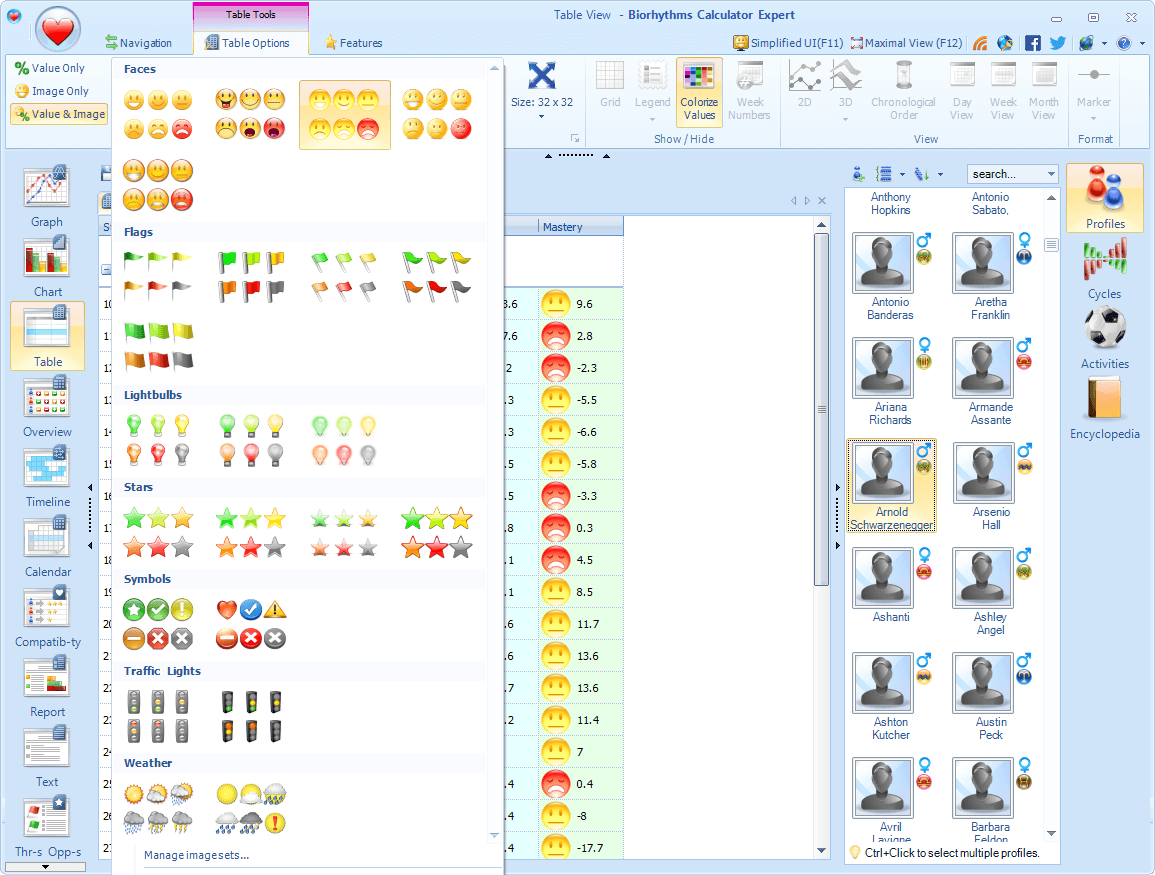
Visualize Your Biorhythms
- Read your biorhythms at a glance by checking various visualizations - graphic symbols that represent your biorhythm status in most views. These consist of graphic icon sets that represent the biorhythm value, and trend indicators NEW that represent cycle trend.
- With graphic icons you can easily tell how well you are doing “biorhythmically” by looking at the icon. When your biorhythms are low, depending on the icon set you selected, you may see sad faces, stormy clouds, red flags, etc. If your biorhythms are high, on the other hand, happy faces, green check-marks, etc will be displayed instead.
- NEWTrend indicators provide even more information as you can see whether you are on the rising or falling trend. Additionally critical, zero, maximum, and minimum days get their own unique symbols, making it easier to notice them.
- There are more than 30 different icon sets to choose from, and you can even make your own icon sets easily using built-in editor!
- Visualizations appear not only in the various biorhythm views (like Table View, or Report View), but also inside mouse-over tips, as well other User Interface elements.
- If you do not like visualizations, you may turn them off completely, so that only numerical value that represents your biorhythm status is displayed.


See Contextual Biorhythm Details
- Dive deeper with interactive views: the info panel and live tips reveal detailed biorhythms information, allowing you to examine a particular time point in depth.
- For example, Info Panel at the bottom will show biorhythms details for the currently selected time point in the view, and as you change the active time point, it will be updated accordingly with NEW icon animations showing the trend.
- The bottom Info Panel includes profile details such as name, time of birth, current date / time information, lunar phase, and of course a snapshot of biorhythms at the selected time point. NEWIt can also show biorhythms statistics for a chosen time period.
- Optional Live Tips provide quick, yet detailed information about biorhythms status as you mouse-over different items in various views. NEWThe latest version supports this feature not just in Graph / Chart views, but most other views as well.
- NEWThese live tips can furthermore be pinned so they remain accessible even after you moved the mouse away from the biorhythm time point.
Intuitive User Interface to Explore Biorhythms
- Intuitive User Interface makes it very easy to use the program.
- Most of the commands are accessible from the Ribbon bar, much like in Microsoft Office, making it very easy to find what you need.
- Detailed mouse-over tips are always there to explain what particular button or option does.
- Main view area can be maximized with a click of a button or by pressing F12, so if you want to concentrate on your biorhythm chart for example, and hide all other panes and toolbars, you can do it very easily!
- There is also a special Simple User Interface mode, specifically designed for new users, in which only the most frequently used commands are shown and the viewing area is increased. This is a great way to get started with the program, as your attention will be focused only on most important features.
- The program remembers all your UI customizations, like the size and position of the window, visibility of certain interface elements, and the rest, so when you reopen the program, it will look exactly the same as when you closed it.


Integrated Biorhythms Tutorial
Learn fast with a step‑by‑step tutorial that highlights shortcuts and features, plus an optional user guide for deeper exploration.
- There is minimal learning curve, and you can easily discover program functionality as you use it.
- Built-in Interactive Tutorial step by step highlights and explains major program features, gives practical tips for using them, and exposes relevant keyboard shortcuts. And of course, you can always turn off the tutorial so it does not get in your way or if you want to learn the app on your own.
- Informative mouse-over tool tips appear when you move your mouse over different interface elements, like buttons, check boxes, etc.
- Detailed User Guide comes with the program as well that addresses all the program's major features.
Get Started Quickly with Biorhythms
Get started using this app in no time at all: a friendly wizard sets up your profile, time zone, and preferences, and even migrates your existing data automatically.
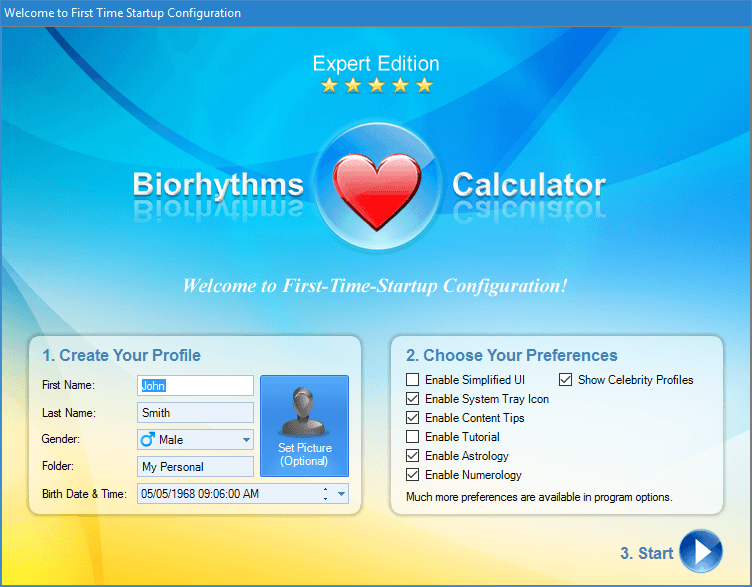
- When you first run the app, a personalization dialog will appear where you enter your name, gender, birth date and time; toggle optional features like Astrology, Numerology, Celebrities; as well as configure major program settings including your preferred timezone for accurate biorhythms calculations. This way you can create your profile and personalize the program for your needs from the very beginning!
- There is also an optional Welcome Screen that greets you every time you start the program. With it you can see your biorhythms and age, current date and time, and moon phase information right away. This way you can instantly learn important facts without even opening the main window!
- Welcome Screen also makes it very easy for you to start using the program, as it offer shortcuts for common operations and links to Internet resources, and displays various tips that provide you with useful information about the program.


Export Your Biorhythms to Calendaring Apps
Keep track of your biorhythms without effort: export events like critical days to iCalendar or Outlook directly and receive reminders right in your favorite calendaring app!
- NEWYou can easily export key biorhythm events to universal iCalendar file format. This includes critical/zero days, maximum/minimum days, cycle phases, activities, lunar phases, and general biorhythm values.
- NEWYou can then import these
*.icsiCalendar files into most calendar applications like Microsoft Outlook, Google Calendar, Apple Calendar, and others. This way you can easily keep track of your biorhythms and automatically receive reminders about events ahead of time! - Additionally, there is also direct Microsoft Outlook support. It is the only biorhythms program that lets you export these biorhythms data into Outlook directly!
- You can precisely control which items you want to export: which cycles, for which profiles, and for which date range!
Personalized Biorhythms Calculator
- There are over 100 different options that let you completely personalize the program to meet your needs!
- For example you can customize how all dates and times are displayed: you can specify date and time formats (both short and long variations), as well as your Time Zone NEW so that all dates and times will be converted to it before being displayed (this does not affect actual calculations).
- There are also various general settings like ability to turn on/off optional features like Animations, Welcome Screen, Astrology, Numerology, Celebrity Profiles, etc.
- And of course there are various view-related settings: how many digits after decimal point are displayed for biorhythm values, calculation precision, font sizes, chart scaling for copying/printing, line thickness, and many more!


Ready to let biorhythms guide your life?
Get this powerful app now to master your days, relationships, and decisions!
Biorhythm Views
With Biorhythms Calculator you can visualize biorhythms in any of the 11 available views, each with its own unique features that provide you with new insights and deepen your understanding of your physical, emotional, intellectual, and other biorhythm states.
All views allow you to specify unrestricted date and time range over which biorhythm information is calculated - (from 100s of years ago to 100s of years into the future); as well as the profiles, cycles, and activities you want to see. Most views also allow you to copy, save, and export data in various formats - from images, to PDFs, to plain text files. And most views can be printed out onto physical paper as well.


Biorhythm Graph View
- This is the primary way to visualize biorhythms - as an interactive graph of sinusoidal curves that represent different cycles.
- You can hover over various data points to see detailed information about each biorhythm at a particular point in time.
- NEWThe all-new charting engine allows for rich animations and subtle hover effects to produce beautiful biorhythm graphs.
- It can display not just biorhythm cycles you select, but also activities NEW and lunar phases NEW, all of which are fully configurable.
- Graph View is very flexible: you can change cycle colors, line thickness, axis, labels, legend position, data-point marker shape & size, and much more!
- You can easily share these charts with others in a number of ways: save it as a jpeg, png, or webp image NEW; export to pdf NEW; or print onto a physical paper.
- NEWUse Crosshair for hot-tracking so that you know exactly what time and value the current position on a chart corresponds to.
- Line Thickness can be customized as well - all the way from ultra thin to very thick.
Biorhythms Table View
- Table View presents biorhythmic data in a structured, tabular format - ideal for detailed analysis.
- Date and Time: Each row represents a specific date and time, allowing for analysis of biorhythms over time.
- NEWOptional Moon Phase Column provides information on the lunar phase for each date.
- Visual Indicators like icons and trend indicators NEW help you visualize biorhythmic states in a clear and intuitive way.
- Numerical Values: Each cell shows the numerical value of the corresponding biorhythm component at the specified date and time.
- NEWColor-coded cells allow for a heat map representation of biorhythm values, making it easier to spot trend changes and important values.
- NEWCustomizable Columns: You can easily sort or filter data by column values.
- "Show/Hide" Functionality: The "Show/Hide" menu allows you to show or hide certain columns or information.
- NEWSummary Statistics are included at the bottom showing RMS averages for a given time period across all selected cycles.
- NEWCompatibilities for Multiple Profiles will also be displayed at the bottom when more than one profile is selected, letting you easily see which cycles are in harmony with each other, and which are not.
- NEWEasily export data to files or copy to clipboard for easy sharing in a variety of formats including CSV and Excel.
- Make physical print-outs of the table in a few clicks with built-in Printing and Print Preview features.


Biorhythm Calendar Views
- Month Calendar View displays biorhythm data in a traditional calendar format, allowing you to see biorhythm predictions for each day.
- NEWWeekly Views show your biorhythms on a week-by-week basis: either 1, 2, or 3 weeks at a time. A single week view can be oriented horizontally or vertically.
- Daily View is ideal for displaying multiple biorhythm values per day, allowing you to see how they change within a single day.
- NEWColor-Coded Biorhythms: Each biorhythm cycle is represented by a different color, aiding in quick visual assessment.
- NEWTrend Indicators: provide extra details so you know not just the values but also in what direction it is changing.
- NEWBiorhythm Phases can now also be explicitly shown allowing you to easily visualize how long each p[hase will last.
- NEWiCalendar Export: Easily save displayed biorhythms data to an industry-standard iCalendar
*.icsfile, enabling compatibility with various calendar applications. - Print Options: You can print-preview and print out your biorhythms calendar on physical paper, allowing you to share or save your biorhythm data for offline viewing.
- Navigation Controls: Includes buttons for moving forward and backward in time (days, weeks, months), facilitating easy navigation through the calendar.
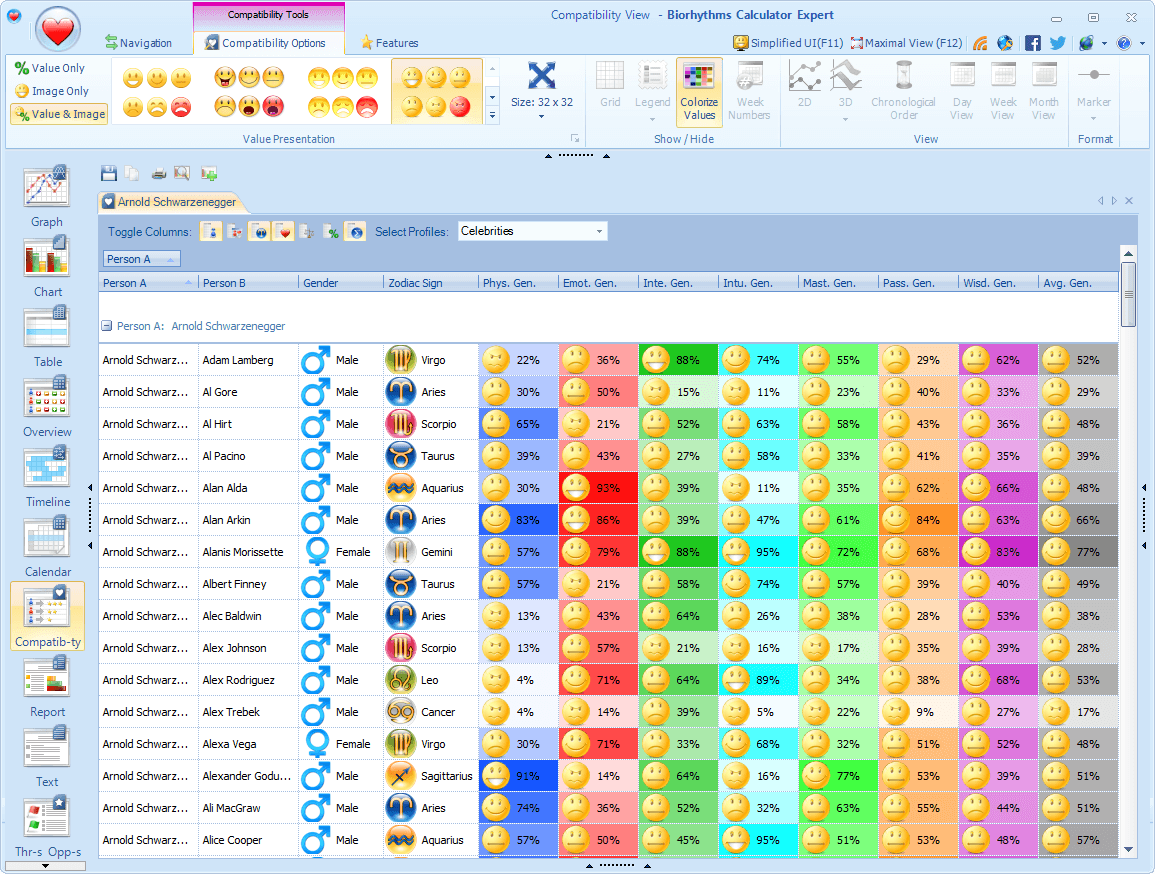
Biorhythms Compatibility Analysis View
- Compatibility View makes it very easy for you to see how compatible you are with others.
- At an instant you can see how compatible you are with all members of your family, your friends, and other people.
- You can see both general compatibility for particular cycles, as well as date-specific compatibilities for particular cycles.
- General compatibility tells you on average how compatible you are with a particular person; while date-specific compatibility tells you how compatible you are with a particular person on a particular date and time!
- All this information is presented in a very customizable table. With a click of a button you can turn columns on and off, enable or disable value colorings.
- NEWFilter & Sort biorhythm compatibilities to quickly find the most or least compatible individuals.
- Of course you can easily save or share the compatibility table: by copying it to clipboard for use in Excel, printing it, or exporting it to CSV NEW or other formats!

Personalized Biorhythms Report View
- You can easily create detailed, personalized, graphical, and branded reports using the Report View.
- You can customize all aspects of report creation: decide for how long the report should run, what biorhythm cycles should be included, which icons should be used (smileys, weather icons, etc.), or perhaps not used at all, etc.
- NEWColor-coded values with trend indicators NEW make it easier to understand the impact of biorhythms on your life.
- Reports display much more than just simple biorhythm information - they show you whether you are in the positive or negative phase, whether a particular rhythm is declining or increasing, etc.
- You can instantly see the best and worst rhythms for a particular day.
- Furthermore, reports provide a lot of useful and specific tips as well as practical recommendations, so that you can quickly see the effects your biorhythms can have on you during a particular interval of time.
- See if you should engage in or avoid certain activities at particular time periods.
- NEWSave or share biorhythm reports by exporting to various file formats:
*.htmlweb pages,*.txtplain text files, and others.
Biorhythms Timeline View
- Timeline View is ideal for visualizing biorhythms over time.
- NEWColor-coded representation of cycles, indicating positive, negative, and critical phases.
- Visual Markers like icons and trend indicators NEW make it easy to spot significant time points.
- NEWSee Biorhythm Coincidences - times when 2 or more cycles meet or intersect - ideal for tracking double critical days or mixed days or other kinds of rhythm interactions.
- Interactive scrolling through different weeks using mouse or keyboard.
- Zoom functionality to adjust the scale and detail of the timeline.
- Display of numerical values for each time point of biorhythm curves.
- NEWiCalendar Export: Quickly export biorhythms information to an industry-standard iCalendar
*.icsfile, for use in various calendar applications like Google Calendar, Outlook, or Apple Calendar. - Print Options: You can print-preview and print out your biorhythm timeline on physical paper, allowing you to share or save your biorhythm data for offline viewing.
- "Show/Hide" options for different components like activities and lunar/cycle phases.
- NEWLive Tooltips providing additional information about the currently selected items.


Threats & Opportunities View
- Get an overview of important biorhythm events such as critical/zero days, maxima and minima, activities, cycle and lunar phases, and biorhythm coincidences.
- NEWAll Biorhythm Coincidences - times when 2 or more cycles meet or intersect are all explicitly listed so you can be sure to know when, for example, a double-critical or a triple-critical day would occur.
- Color-coded visual indicators such as icons and trend indicators NEW allow you to easily identify the type and importance of the event.
- Chronological & Grouped display modes let you choose the best representation of key biorhythms data - allowing you to focus either on certain date range or certain types of events - depending on your needs.
- Details Column provides informative description of the identified biorhythm event.
- NEWFiltering and Sorting options allow you to focus on specific types of biorhythm events (e.g., maxima, critical days).
- NEWEasily export biorhythm events to iCalendar
*.icsfiles for use in various calendar applications like Google Calendar, Outlook, or Apple Calendar, so you can be automatically reminded about upcoming biorhythm events. - Print Options: You can print-preview and print out displayed biorhythm events on physical paper, allowing you to share or save it for offline viewing.
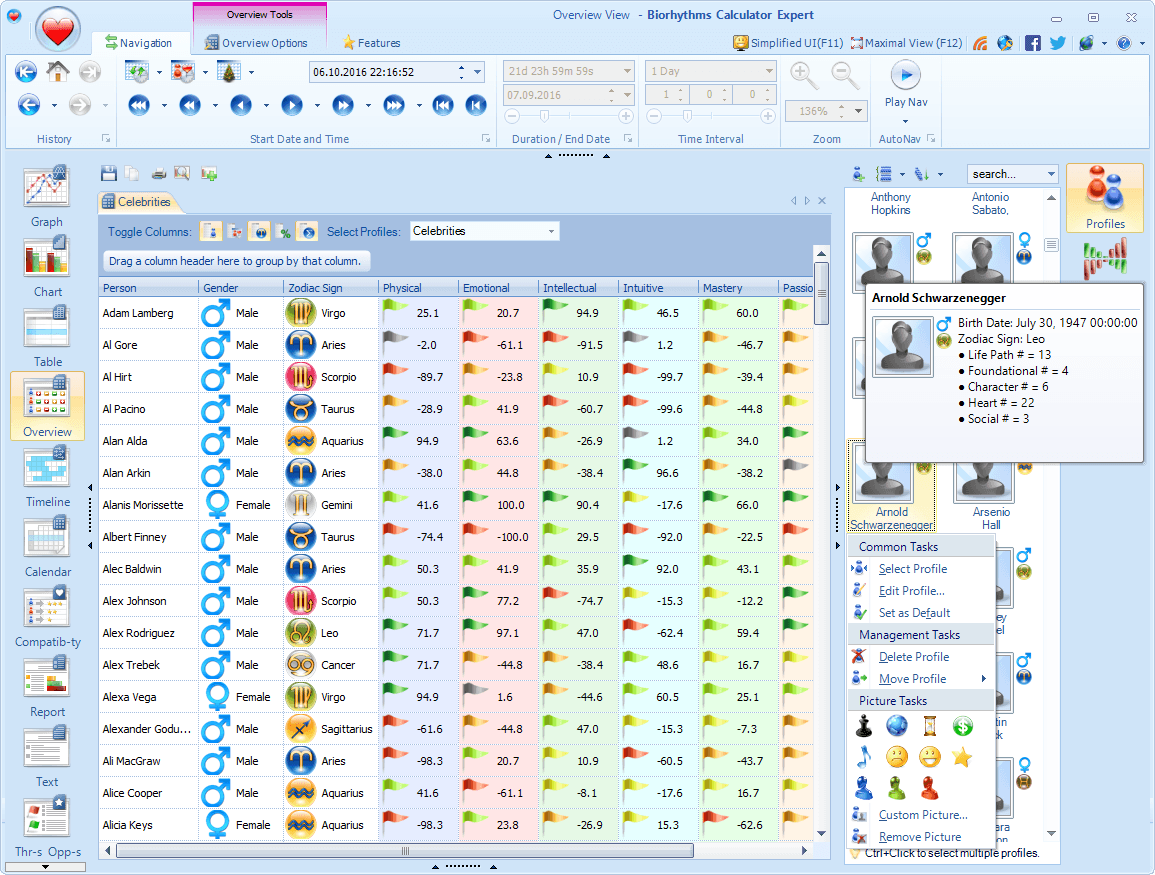
Biorhythms Overview for Groups
- Multiple Profile Display: The Overview View allows for the simultaneous display of multiple biorhythm profiles, enabling comparative analysis.
- Customizable Columns: You can rearrange and toggle which columns (e.g., Gender, Birth Times, Cycles) are displayed, providing flexibility in the information presented.
- Color-Coded values with icons and trend indicators NEW make it easy to quickly identify trends and patterns across different profiles.
- Live Tips: Hovering over data points or columns provides contextual tooltips explaining the meaning and significance of the values.
- NEWFilter, Group, & Sort biorhythm values to quickly find individuals with specific biorhythm characteristics.
- Easily save or share the overview table: by copying it to clipboard for use in Excel, printing it, or exporting it to CSV NEW or other formats!


Chart View
- This is a bar-chart version of the Graph View and works in much the same way.
- You can hover over bars to see detailed information about each biorhythm at a particular point in time.
- NEWThe all-new charting engine allows for rich animations and subtle hover effects to produce beautiful biorhythm charts.
- It can display not just biorhythm cycles you select, but also activities NEW and lunar phases NEW, all of which are fully configurable.
- Chart View is very flexible: you can change cycle colors, line thickness, axis, labels, legend position, and much more!
- You can easily share these charts with others in a number of ways: save it as a jpeg, png, or webp image NEW; export to pdf NEW; or print onto a physical paper.
- NEWUse Crosshair for hot-tracking so that you know exactly what time and value the current position on a chart corresponds to.
Text View
- Text-based Report displays biorhythms information in a textual format for easy readability, and is basically a simplified version of the Report View.
- With it you can easily create detailed, personalized, and branded biorhythm text reports.
- You can customize all aspects of report creation: decide for how long the report should run, what biorhythm cycles should be included, etc.
- NEWColor-coded values with trend indicators NEW make it easier to understand the impact of biorhythms on your life.
- Biorhythm text reports display much more than just simple biorhythm information - they show you whether you are in the positive or negative phase, whether a particular rhythm is declining or increasing, etc.
- Text reports also provide a lot of useful tips and practical recommendations, so that you can quickly see the effects your biorhythms can have on you during a particular time period.
- See if you should engage in or avoid certain activities at particular time periods.
- NEWSave or share biorhythm text reports by exporting to various file formats:
*.htmlweb pages,*.txtplain text files, and others.


Biorhythms Journal
- Biorhythms Journal lets you record your actual condition and feelings for a particular day whenever you sense a difference between how you feel vs what biorhythms predict.
- Journal entries are displayed in a chronological list format, organized by date and then by biorhythm cycle.
- Each entry includes the date, biorhythm cycle name, predicted value, your perceived condition called Real Value as a numeric value between -100% and 100%, and a free-text comment field for personal reflections.
- A "Real Value" column indicates your actual experience.
- Each profile gets its own Journal, so there is no limit to how many journals you can have.
- Journal View seamlessly integrates with the majority of other views, allowing for quick contextual journal entry via context menus as well as displaying applicable journal entries for corresponding time point in live tips.
Demo Videos
See Biorhythms Calculator in action, discover its powerful features, and learn how to use them by watching video demonstrations below! While some videos showcase an earlier version of Biorhythms Calculator, everything shown there still applies to the current version as well.


These videos were created by www.CaptainBiorhythm.com.
Start Tracking Your Biorhythms Today
Get this powerful software to understand your peak performance windows and avoid low‑energy pitfalls!
What's New in Biorhythms Calculator 2026
- All-new Charting Engine produces beautiful, animated biorhythm graphs and charts designed for style and clarity without sacrificing any detail.
- Biorhythm Coincidences feature allows you to see all times when 2, 3, or 4 biorhythm cycles meet or intersect, so you are alerted in advance when such rare events will occur. For example cycle coincidences like double-critical days or triple intersections will be shown in various views including Calendar, Timeline, Threats and Opportunities.
- Biorhythm Trend Indicators that mark a point on a cycle as either falling/rising, critical/zero, or minimum/maximum will be displayed next to the biorhythm value in all views. This allows you to instantly see not just the current biorhythm state, but also the direction of change over time, thus helping you make better decisions based on your biorhythm trends.
- Biorhythm Cycle Improvements include support for new combination cycle types, extended periods of up to 9,999 days, and ability to display cycle phases in various views.
- Add more profiles easily: batch-import profiles from Excel or CSV files, or from VCF vCards.
- Timezone-Aware Biorhythms: The program now has full timezone awareness for precise biorhythm calculations, this includes birth time zone and display time zone settings.
- Major Activities Improvements: supported on biorhythm charts, can be assigned a specific color, may be defined using inverted biorhythm value ranges, and can be designated as "anti" to indicate them as periods of time to stay alert.
- iCalendar Export: You can easily export key biorhythms events like critical/zero days, maximum/minimum days, cycle phases, activities, and more to various calendaring applications in universal iCalendar ICS file format. This way you can easily keep track of your biorhythms and automatically receive reminders about events ahead of time!
- All Views have been greatly improved: from increased font size for better readability, to sorting and filtering in tabular views, to moon phase display, to hot-tracking with live tips, and more.
- Table View Improvements: heatmap color coding, summary and compatibility statistics display, filtering support, active cell tooltips, key biorhythm values highlighting, biorhythm trend indicators, automatic column sizing, increased font size for readability.
- Calendar View Improvements: new horizontal week, 2-week, and 3-week layouts; heatmap color coding; support for showing activities, cycle and lunar phases across multiple days they span; biorhythm trend indicators; improved printing support; and more.
- Timeline View Improvements: support for showing cycle phases and lunar phases, summary statistics for cycles and activities, heatmap color coding, biorhythm trend indicators, hovered item tooltips, key biorhythm values highlighting, and more.
- Threats and Opportunities View Improvements: detailed descriptions, cycle coincidence display (e.g. double-critical days), custom cycles support, cycle phase information - positive/negative and ascending/descending, icon and trend visual indicators, sorting and filtering support, export of key biorhythm events to iCalendar ICS format, cycle colorization, improved printing.
- Multi-profile view improvements in Compatibility and Overview views: heatmap color coding, row filters, active cell hot-tracking, key biorhythm values highlighting, biorhythm trend indicators, increased font size for readability.
- Report and Text views now support cycle color-coding and biorhythm trend indicators. They also have separate section for "anti" activities.
- Biorhythm Journaling Improvements: increased font size and value colorization for better readability, sorting and filtering of journal entries, date-times rounding for better visibility, active entry tracking, journal details are now surfaced in tooltips for dates.
- Data Export and Sharing is now supported in more formats: iCalendar, PDF, WEBP, CSV, and others.
- Seamless Upgrade Path: all your existing data - profiles, cycles, activities, etc. will be automatically migrated to the new version, so you won't need to spend time to manually re-enter it all again and can instead start enjoying the new version right away.
- Improved User Interface with new functionality, better ease of use, and refreshed look.
- This upgrade features full Windows 11 compatibility, with full support for Windows 10 and older versions of Windows - all the way to Windows 7.
- All-New Overview View - provides summary of biorhythms states of up to 150 people for a given date.
- You can now copy data from tabular views (Table and Compatibility) directly into Microsoft Excel for further analysis
- Astrology and Numerology are now part of Expert Edition only and are entirely optional (they can be completely turned off)
- Outlook support is now included with Expert Edition
- More visualizations have been added
- Informative biorhythms Bonus E-Book is included in addition to Biorhythms Encyclopedia
- Improvements in User Interface - new tooltips, less clutter, better wording, etc.
- Windows 8.1 support
- Performance enhancements
- Much more!

- All-New Compatibility View allows to see at a glance biorhythm compatibilities of up to 150 people.
- Improved User Interface and a new theme
- Extended support for user defined cycles
- Simplified User Interface option for beginning users or those who do not want to access all features at once
- Upon exit, the program now remembers all your customizations: active view, active tabs, selected cycles and profiles, etc. support
- The following views were considerably improved: Report, Graph, Chart, Table
- Much more options have been added, allowing for easier customization
- Improved clipboard support throughout the program
- Lots of performance and stability improvements
Awards & Reviews
These are just some of the awards won by Biorhythms Calculator over the years…


Hear Direct from Our Customers!
